Data Visualisation (Successful & Failed Case)
GitHub Code: https://git.arts.ac.uk/21020295/Reeflection/tree/main/DigitalContent
This project, I worked on the two data visualisation animations to tell the contrasting stories of two artificial reef projects: one successful case in Pulau Weh, Indonesia, and one failed case at the Osborne Reefs in Florida, USA.
As the content will be played on a small screen, any statistic or numbers will not be readable. The goal was to move beyond static graphs and numbers, creating more visual stories that show transformation over time — inviting viewers to feel the ecological impact in an intuitive, engaging way.
Screen 2: Successful Case (ARs in Pulau Weh, Indonesia)
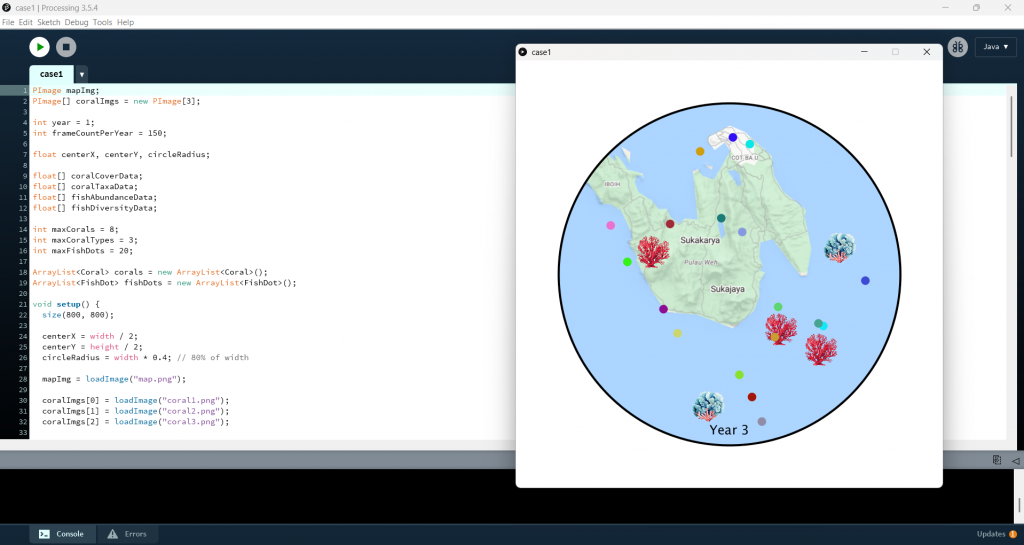
The Pulau Weh animation visualises the recovery and transformation of artificial reefs over three years, using real monitoring data on coral and fish life.
Here’s how it works:
- Circular Map Canvas:
To provide the periscope effect, the animation needs to takes place on a circular map of the Pulau Weh reef site. - Coral Data as Images:
Coral cover percentage is translated into the number of coral images (small coral PNGs), with the number of coral taxa determining how many different types (species) appear. Over the three years, viewers see the reef filling in and diversifying, reflecting the real improvements in coral health. - Fish Data as Colored Dots:
Fish abundance is represented by dots scattered across the coral area, while fish diversity is shown using a range of dot colors. Over time, the dots increase in number and variety, visualising the boost in fish populations and biodiversity. - Smooth Year-to-Year Transitions:
The animation cycles through the first, second, and third year, allowing viewers to directly see the positive trajectory — a small reef area growing into a thriving ecosystem.
This visualisation celebrates ecological restoration and highlights how well-planned artificial reefs can support marine biodiversity.
Screen 3: Failed Case (ARs in Broward County, Florida, USA)
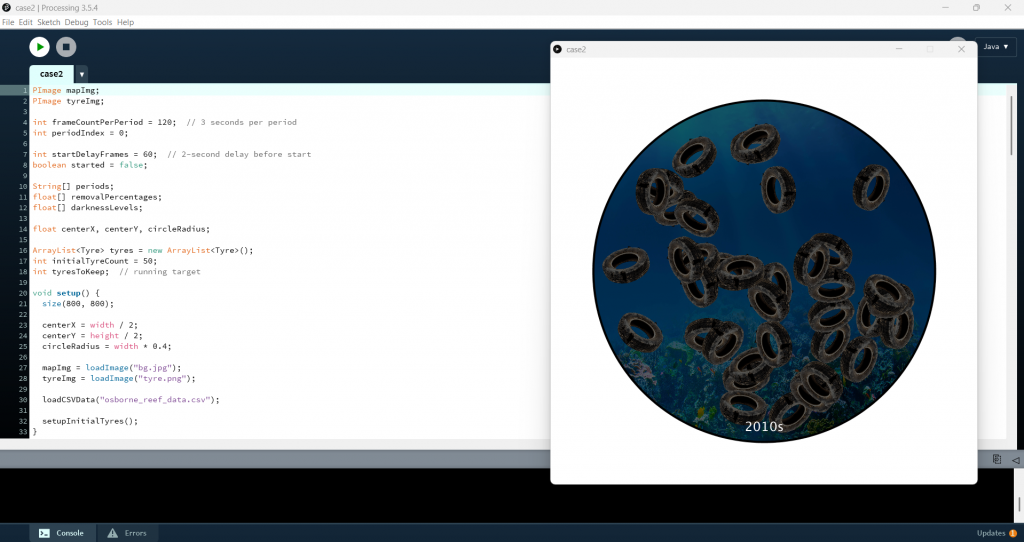
In contrast, the Osborne Reefs animation visualises the failure of one of the world’s most infamous artificial reef projects: a site where over a million old car tires were dumped into the ocean in the 1970s — with horrible consequences.
Here’s the approach:
- Circular Map Canvas:
Again, the animation uses a circular canvas, this time showing a scene underwater. - Tyres Implementation:
The animation begins by placing 50 tire images across the canvas, representing the dumped tires. - Darkness Overlay:
To symbolise ecological degradation, a semi-transparent black overlay darkens the scene decade by decade — increasing from 35% darkness in the 1970s to 80% blackness by the 1990s. - Cleanup Efforts and Lightening:
Starting in the 2000s, some tires are gradually removed based on real cleanup data (e.g., 1% removal in the 2000s, 23% in the 2010s, 34% in 2020-2024), and the overlay lightens accordingly, visualizing partial recovery. - Time Labels:
A time label on the canvas marks each decade, guiding viewers through the decades-long environmental story.
This visualisation communicates the weight of environmental failure and the challenge of undoing ecological damage once it’s done — reinforcing the need for careful planning and long-term thinking.
Reeflection
Looking back on this week, I’ve realised translating numbers and facts into something visual and emotionally engaging was definitely not easy. I kept finding myself caught between accuracy and aesthetics: I wanted the data to be meaningful and clear, but I also wanted the visualisation to feel alive, to tell a story, not just display statistics.
One of the biggest things I learned this week is how important pacing and clarity are. If too much is happening on the screen at once, it’s overwhelming. If too little happens, it’s boring. Finding that sweet spot took a lot of trial and error. I also found myself thinking a lot about audience perspective — how will someone with no background knowledge read this visual? Will they understand what it’s showing? Will they care?
I’m starting to see how all the pieces of this project connect and how the digital elements can really amplify the core message if I get them right. It’s been a demanding process, but I’m proud of the progress so far.